This project is based on publicly available Olist datasets (a relational database) from Kaggle. The snowflake model was created by establishing complex relationships between tables to ensure proper data filtering.
In this Power BI report, the visuals showcase the total sales trend over two years, total sales by payment type, and total sales by customer’s state. Filter slicers for year and customer’s state allow for dynamic exploration.
In this report, the visuals showcase total sales and average review scores by product category, as well as total sales, total orders, and average order value. The average review score was calculated using a complex DAX formula.
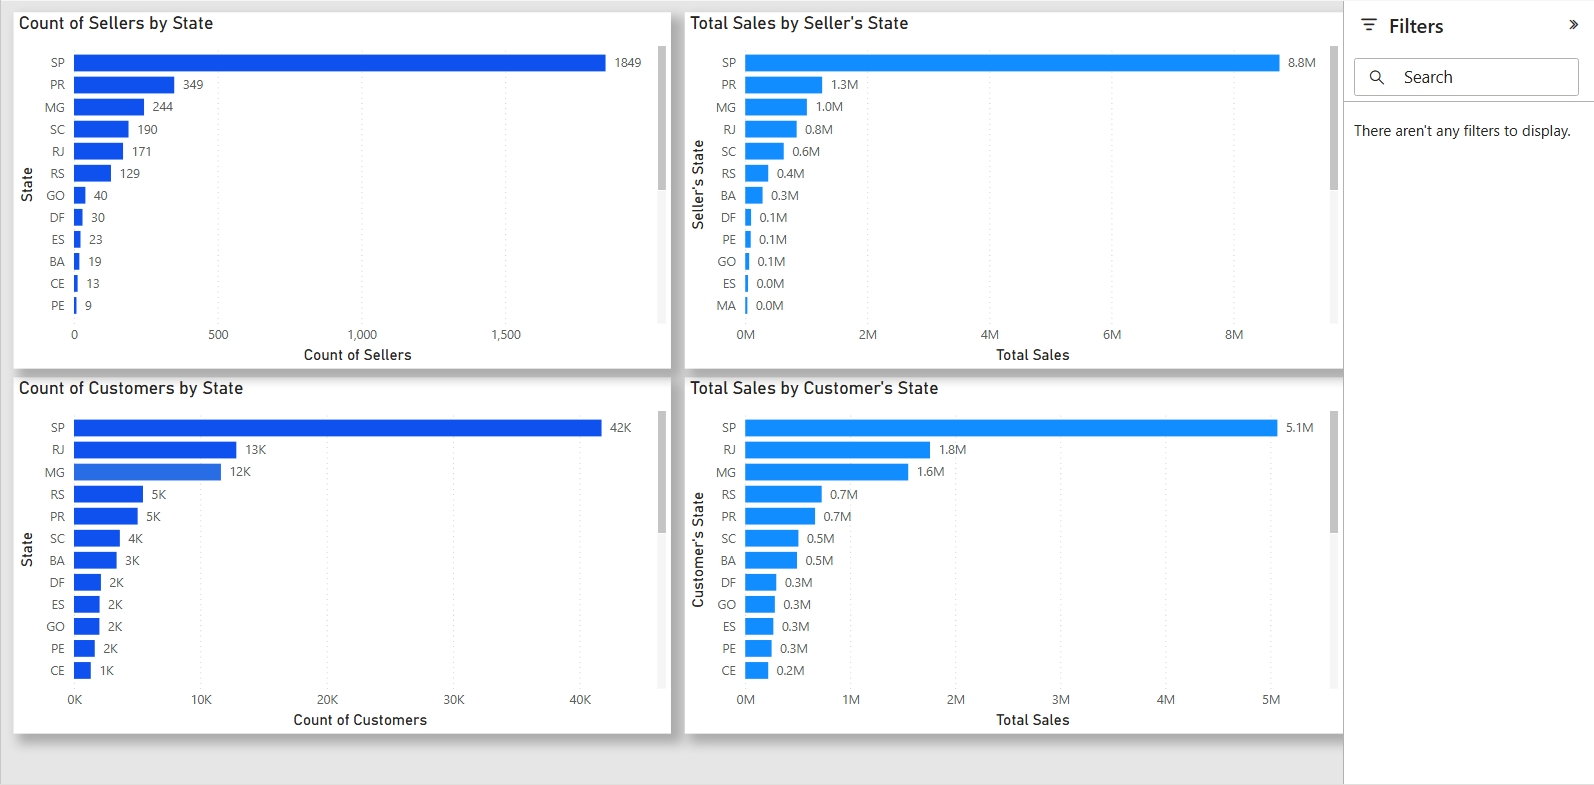
These four visuals showcase total sales by seller and customer, as well as the count of sellers and customers by state.
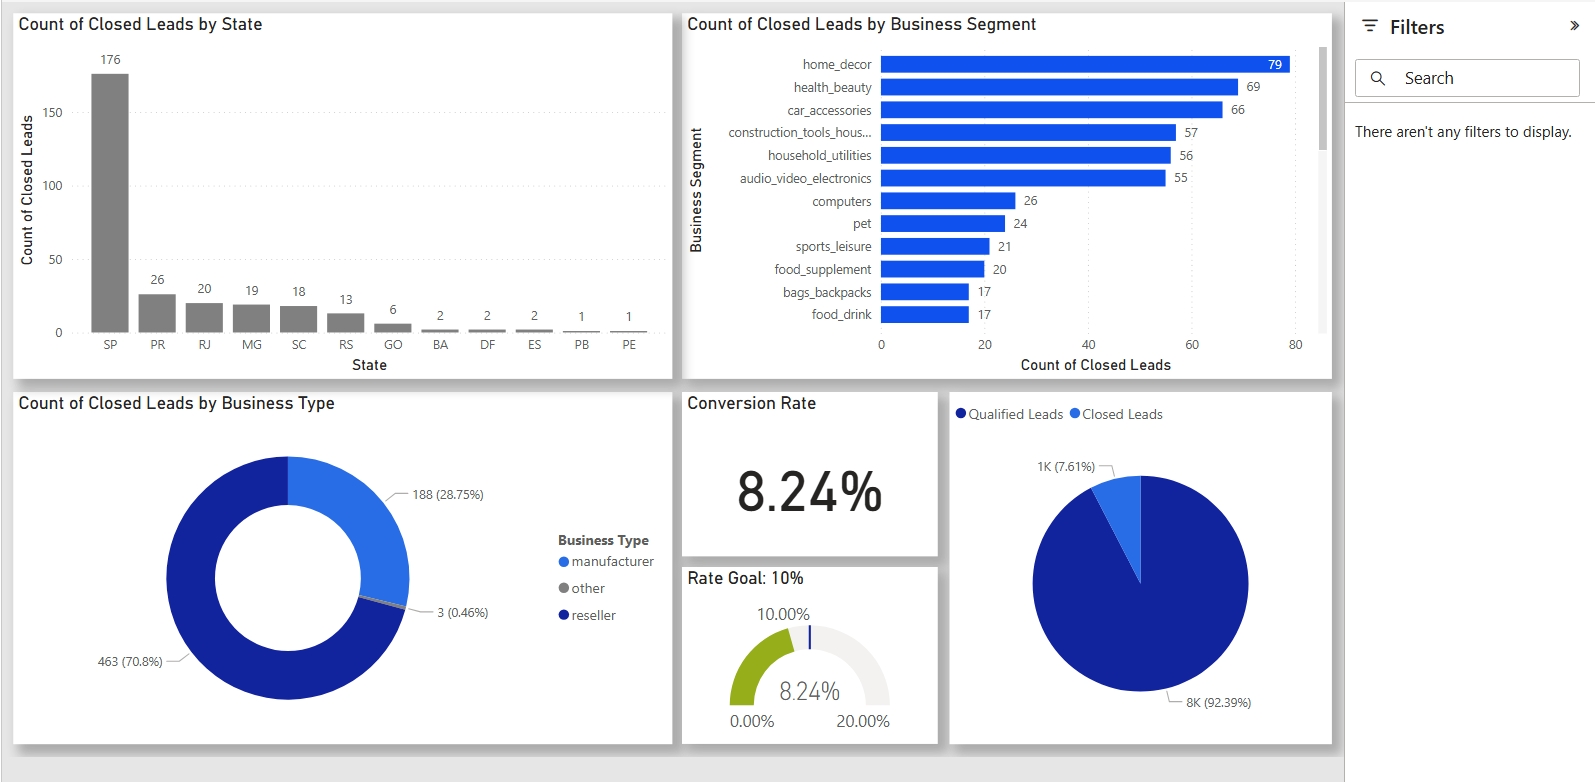
These graph visuals showcase the count of closed leads by state, business segment, and business type. Other visuals display the conversion rate, target rate, and the total percentage of closed and qualified leads.
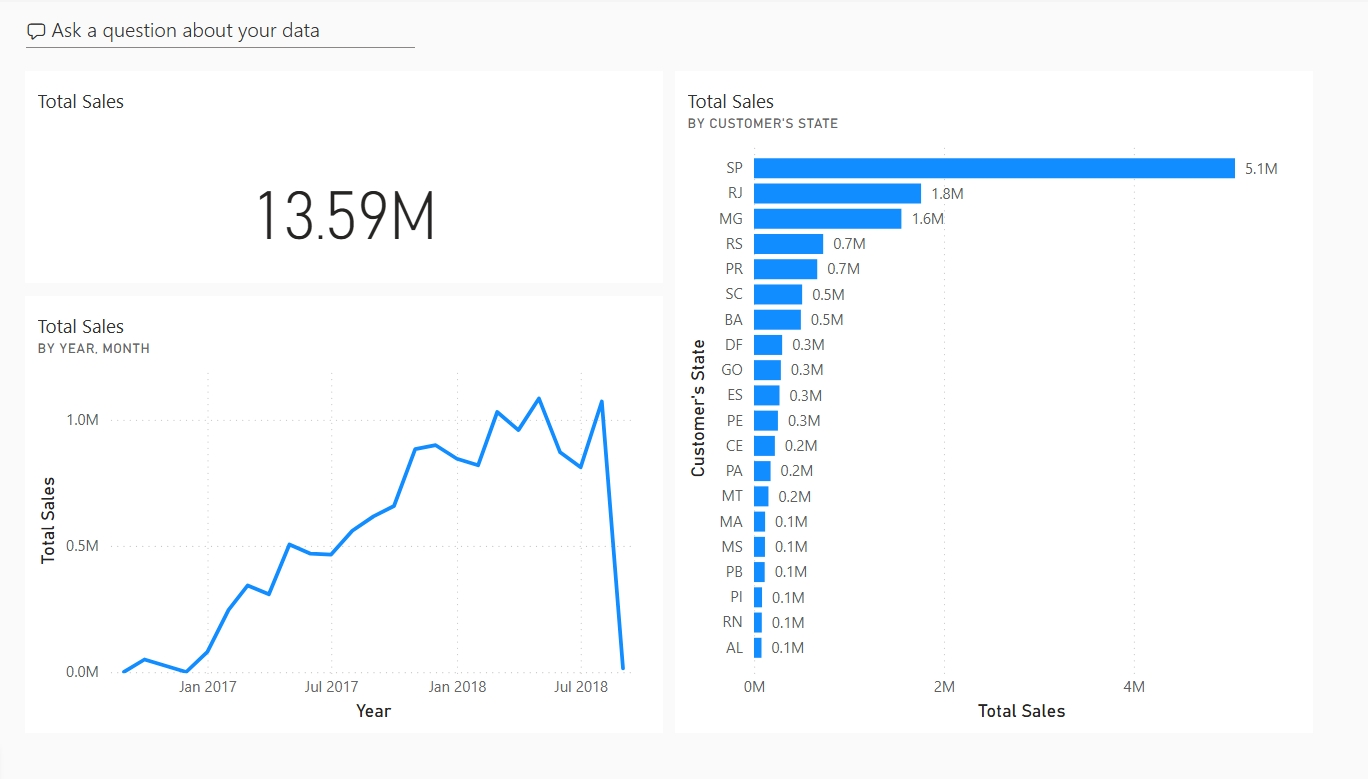
These visuals were pinned from different reports within the Olist Power BI development environment to the dashboard.
Use the interactive charts and filters below to explore trends and patterns.


