This Power BI dashboard analyzes Chicago crime data sourced from Google BigQuery, using DirectQuery for real-time updates. It provides insights into crime trends, locations, and categories, allowing users to explore patterns through interactive visualizations and geospatial mapping.
This report page shows crime trends over the years, with filter slicers for domestic boolean, crime type, and description.
This page features visuals showcasing crime trends by month and crime count, with filter slicers for year, domestic boolean, crime type, and description.
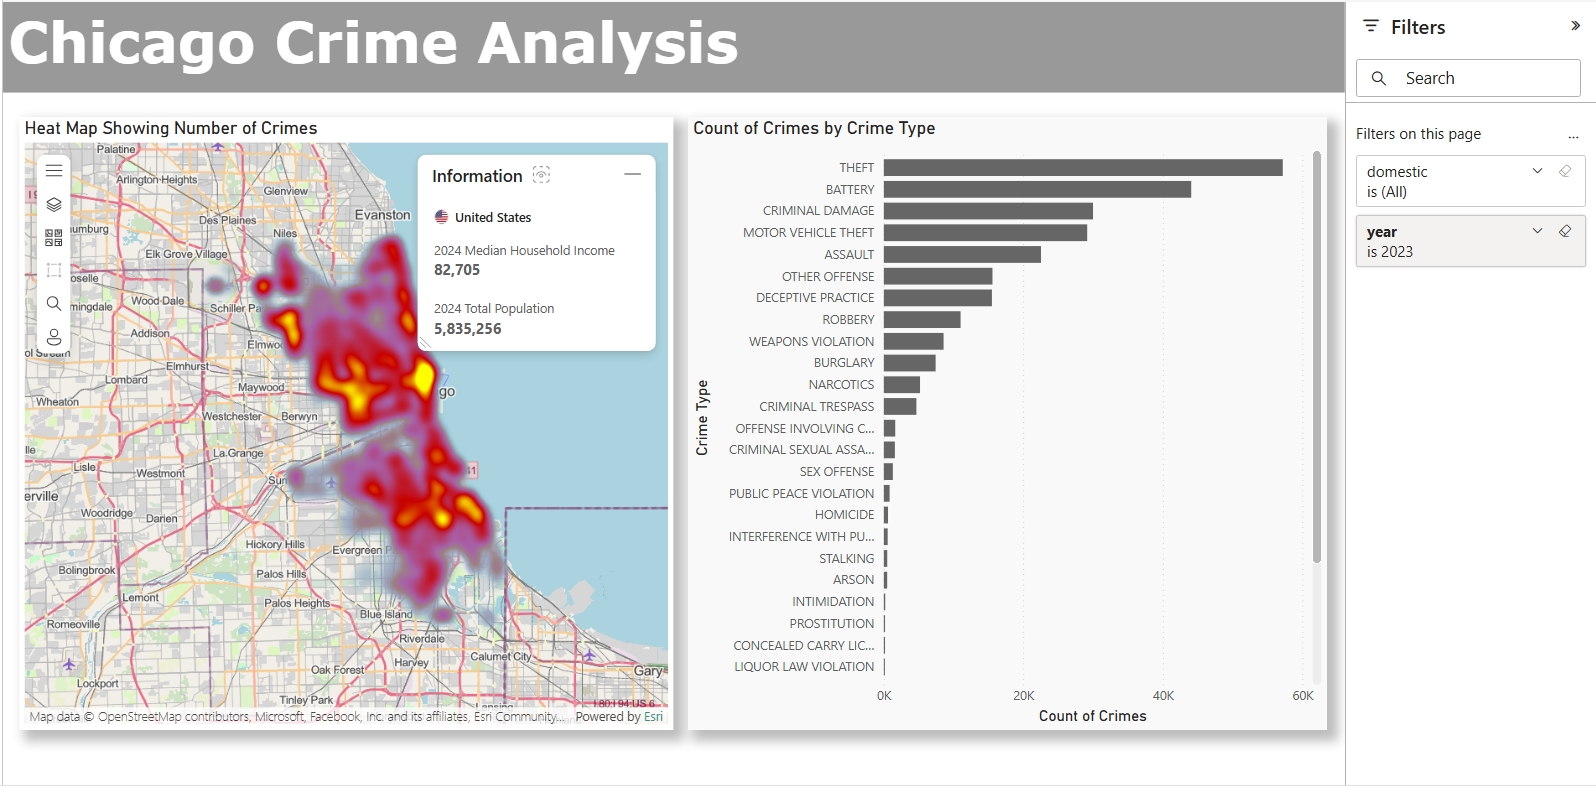
In this report page, a heat map displays the number of crimes in different locations, while a bar chart shows the crime count for each crime type. By clicking on “Theft” in the bar chart, you can see the corresponding heated locations on the map.
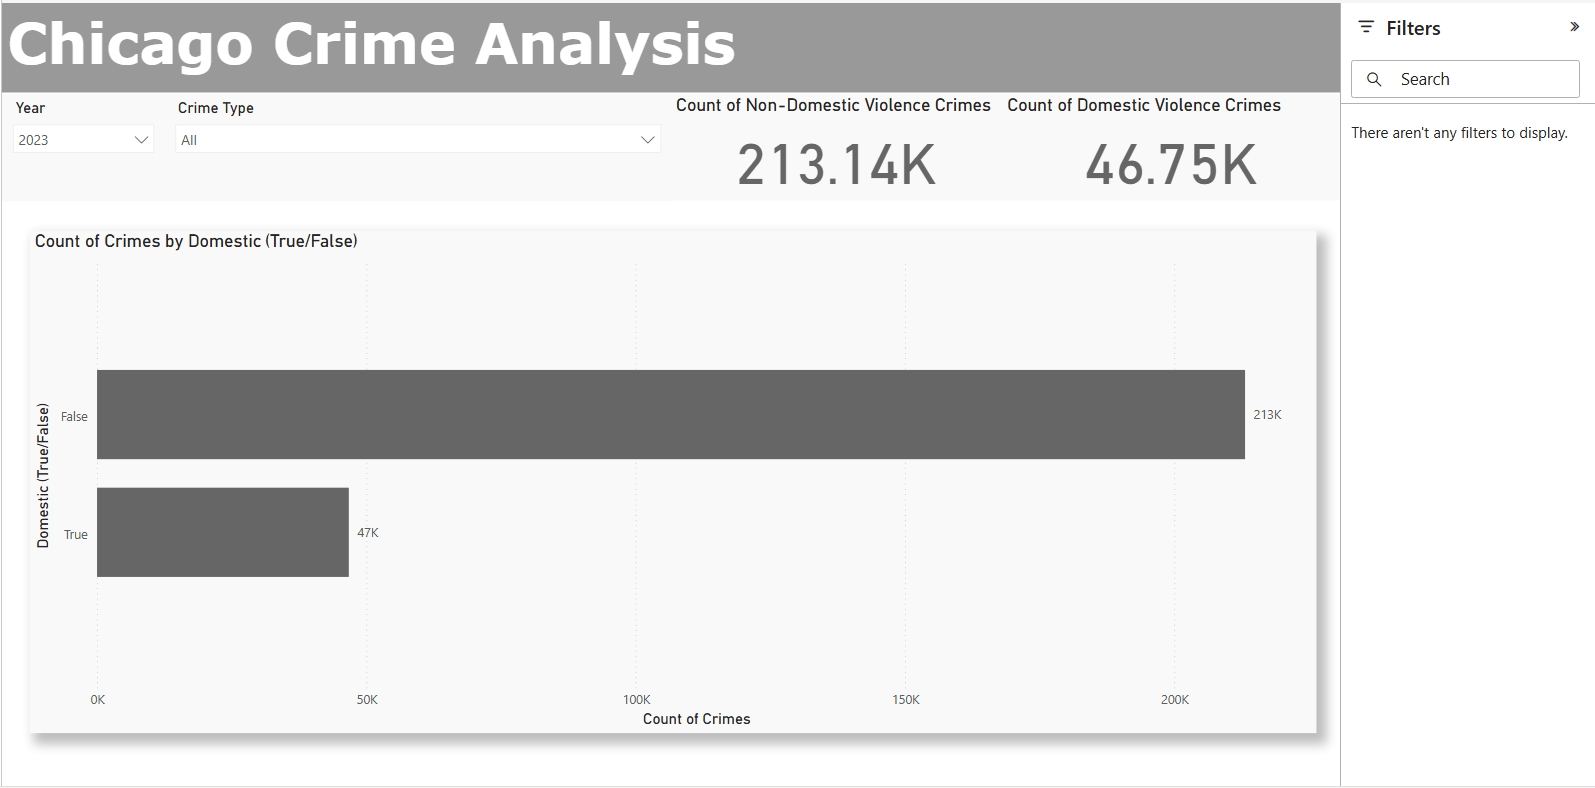
A bar chart displays the number of crimes for both domestic violence and non-domestic violence, with filter slicers for year and crime type.
Use the interactive charts and filters below to explore trends and patterns.


