This interactive dashboard provides a comprehensive analysis of car prices based on key factors such as brand, model, year, fuel type, transmission, and mileage. Users can explore price trends, compare average prices by category, and filter data to identify value-for-money options. Designed for dealerships, car buyers, and market analysts, this dashboard makes it easy to understand pricing patterns and make data-driven decisions.
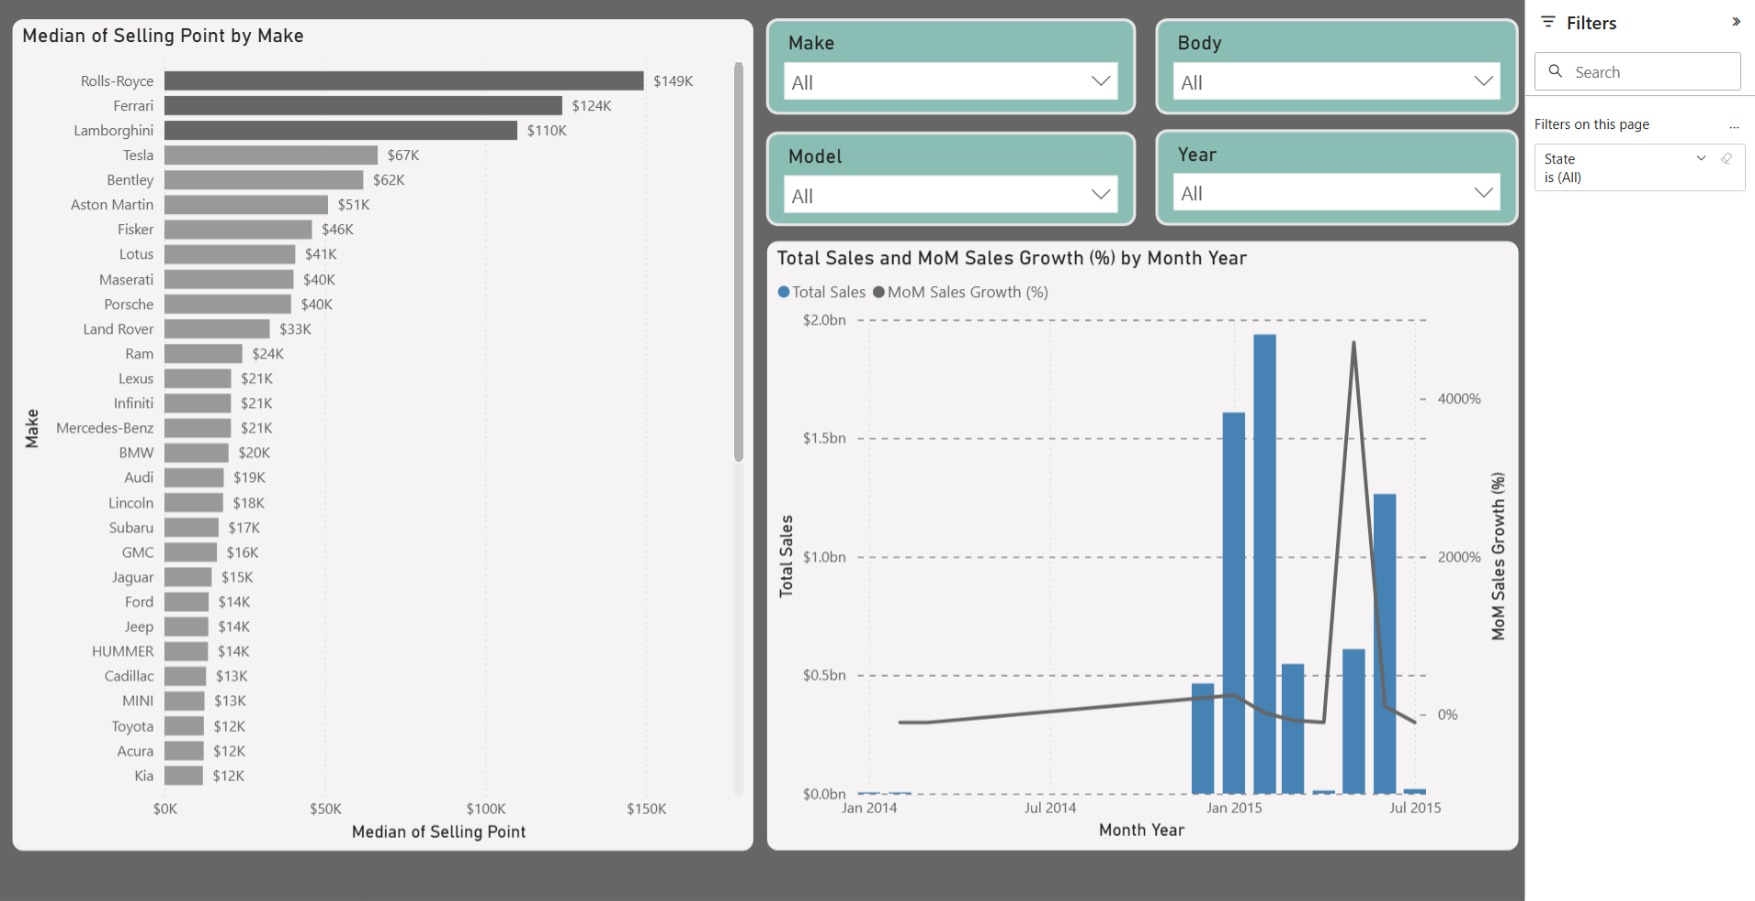
This report page displays the median selling price by car make, along with total sales and month-over-month sales growth (%) by month and year. It includes filter slicers for make, body, model, and year.
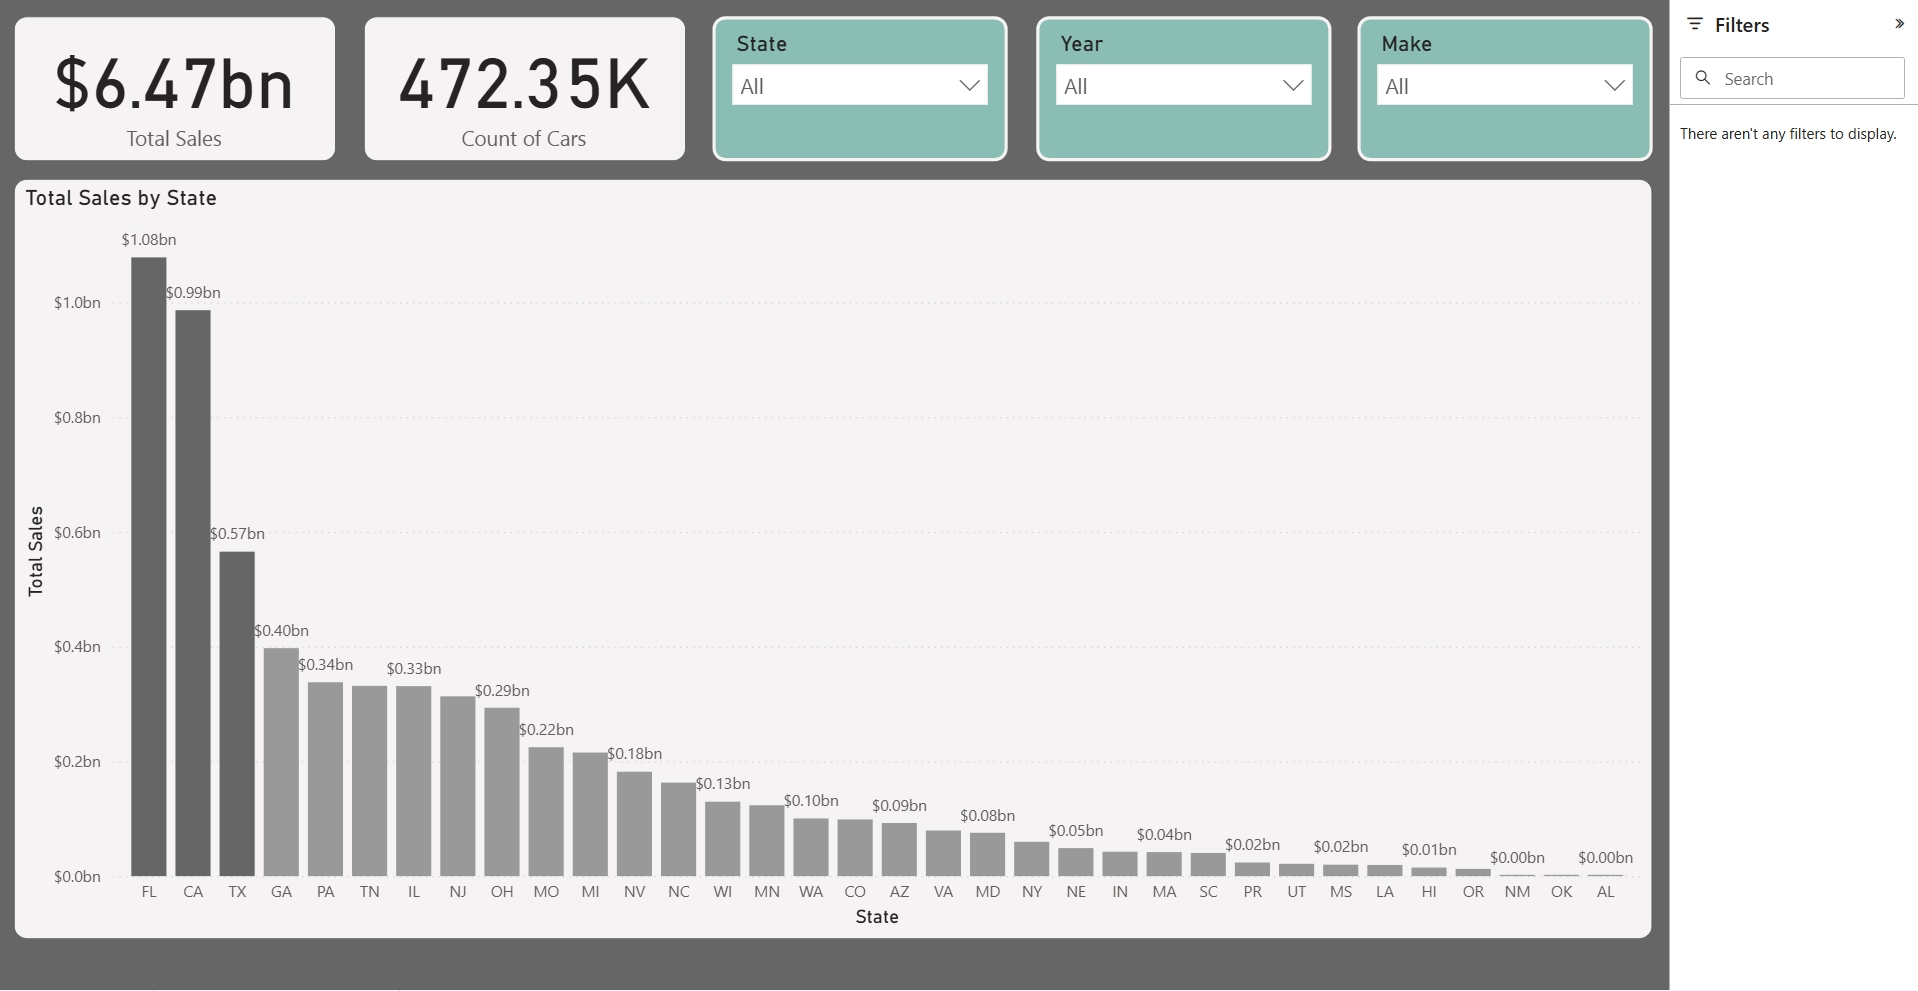
This page features visuals displaying total car sales by state and KPI cards, with filter slicers for state, year, and make.
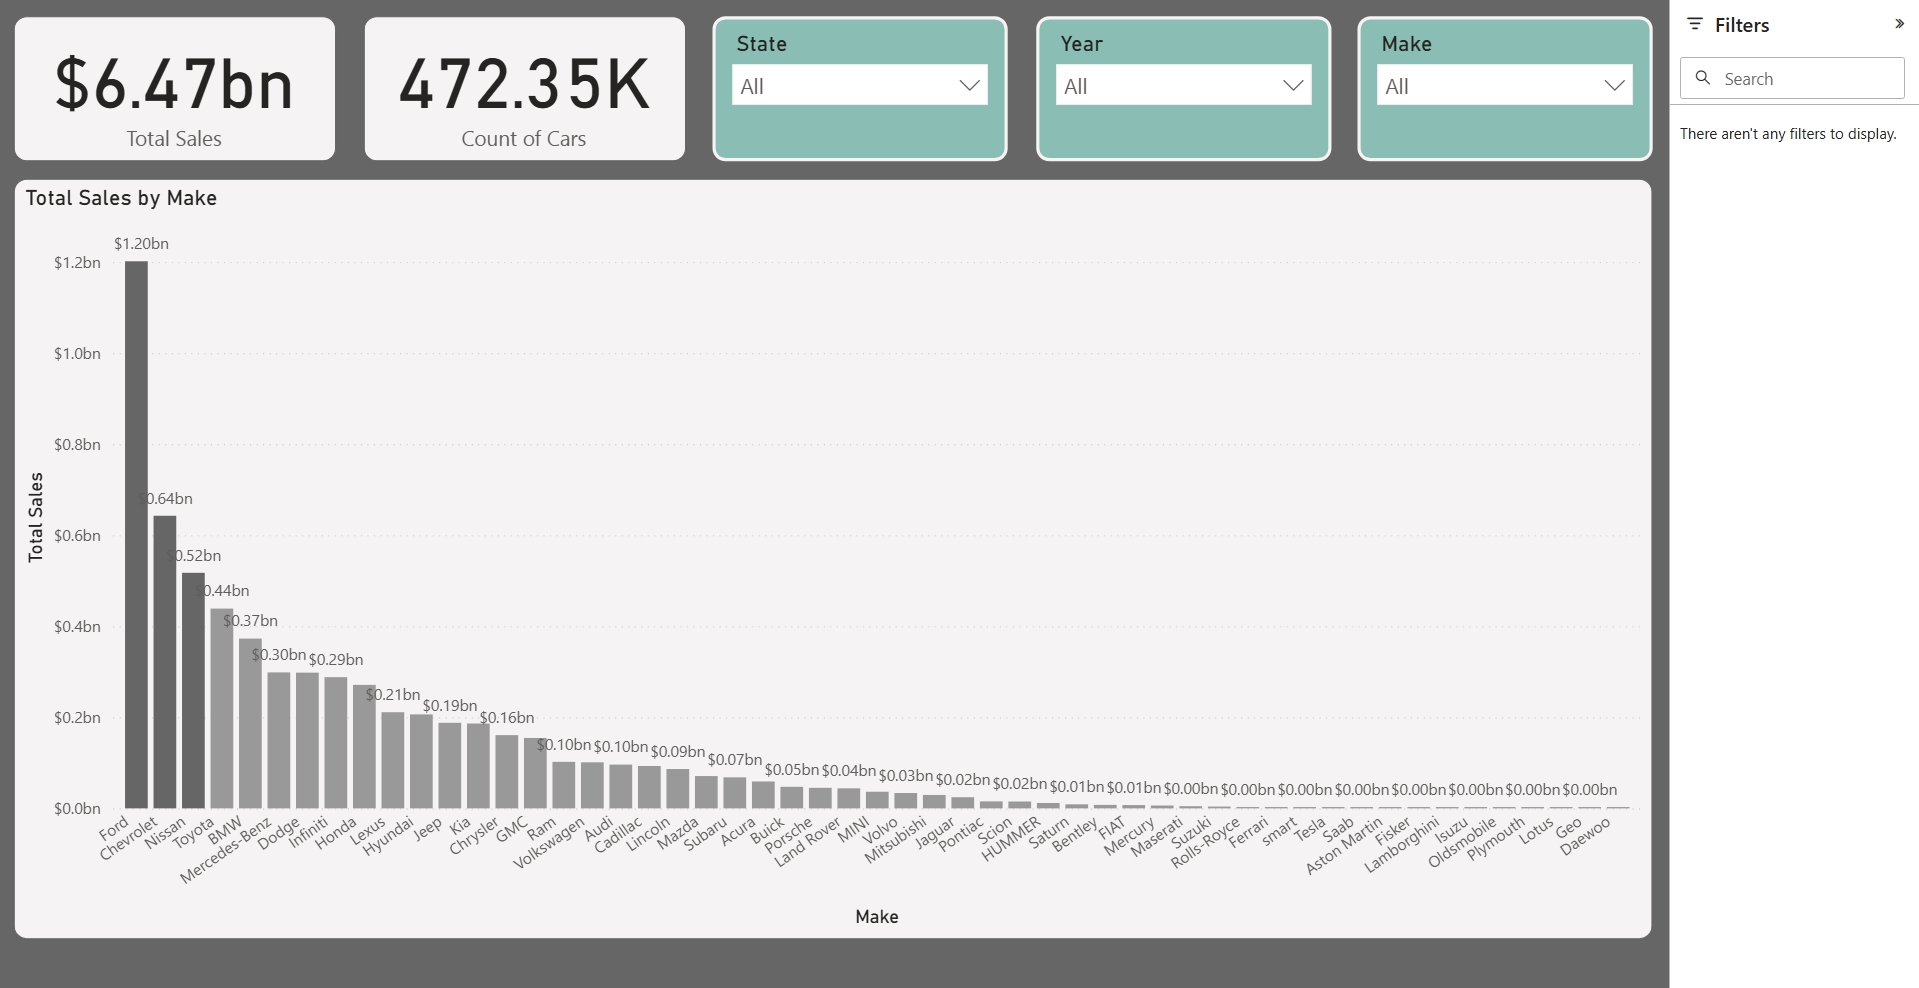
This page features visuals displaying total car sales by car make and KPI cards, with filter slicers for state, year, and make.
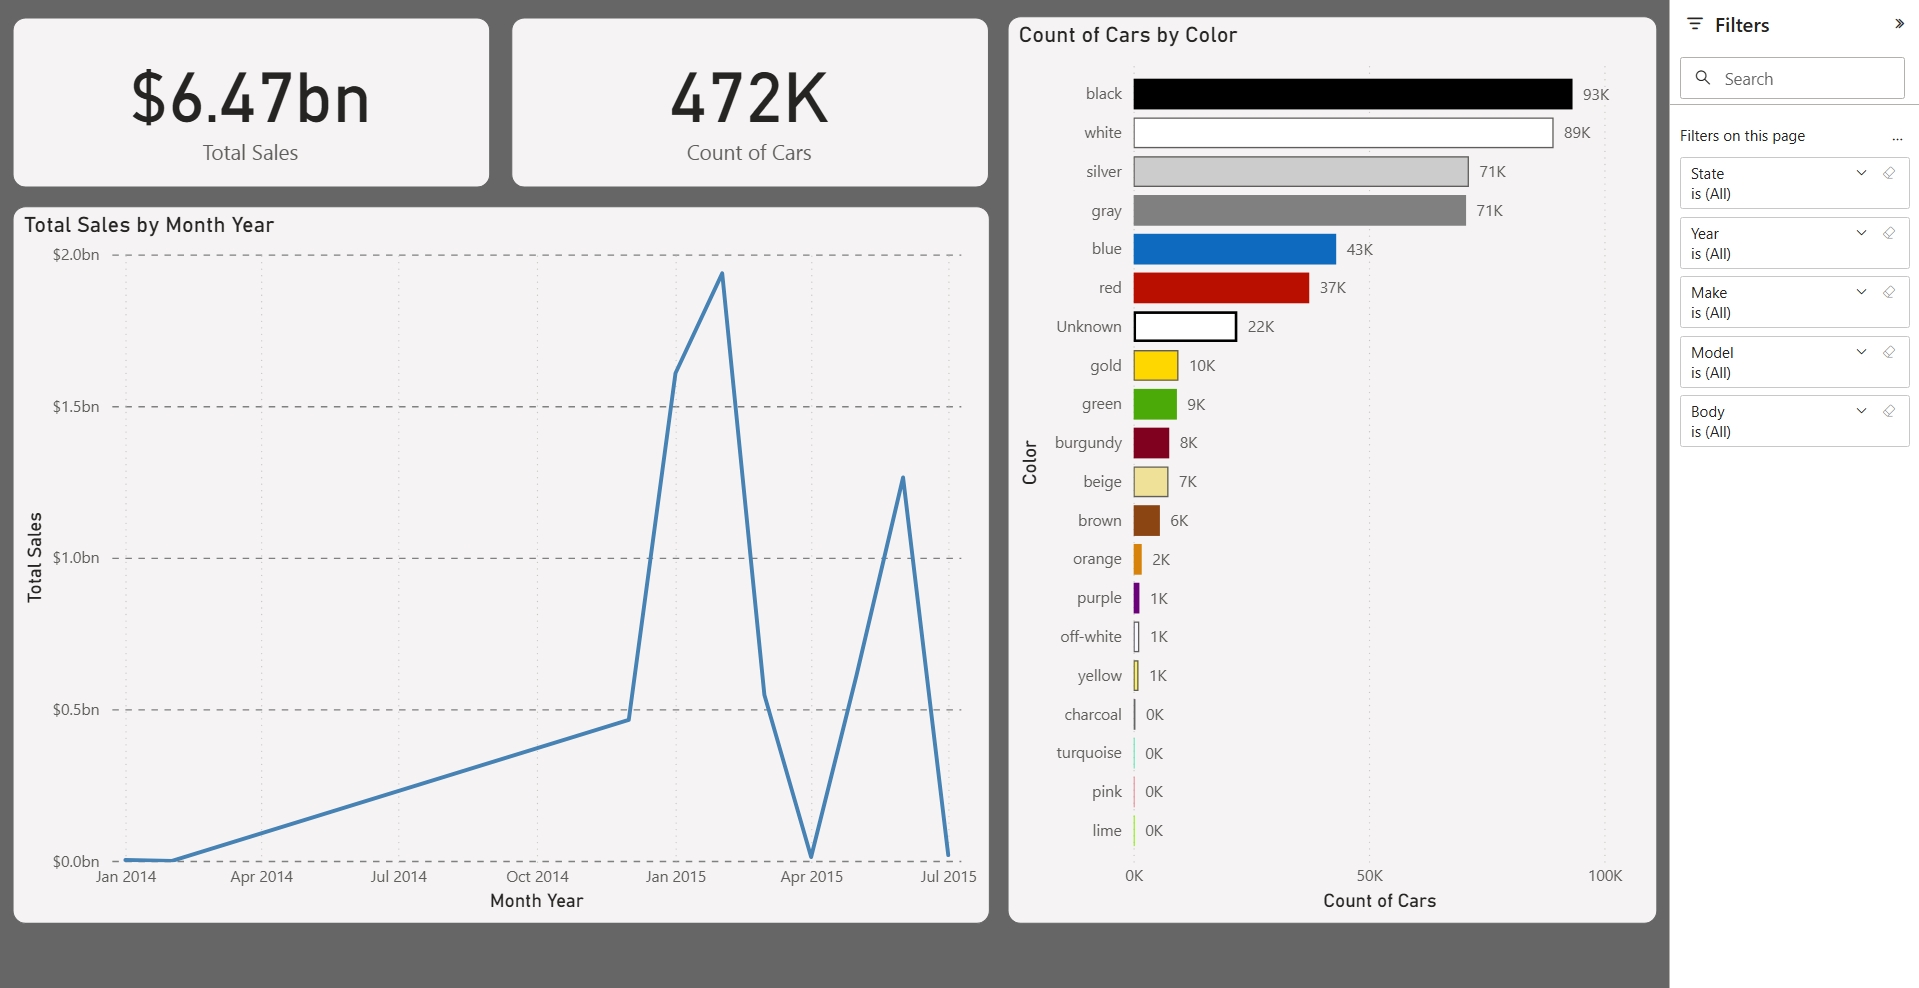
A line chart displays total sales by month and year, while a bar chart shows the number of cars by body color. Additional filters are available on this page.
A bar chart displays the average selling price and average MMR by month and year for a specific car make, accompanied by a KPI card showing the average percentage difference between sales and MMR. Additional filters are available on this page.
Use the interactive charts and filters below to explore trends and patterns.


