This project is based on a publicly available dataset consisting of multiple tables sourced from Microsoft’s Adventure Works.
In this “Overview” report page, these visuals show total sales and profit margin by month, total sales by category and country, and total quantity by category. Filter slicers are available for year and region selection.
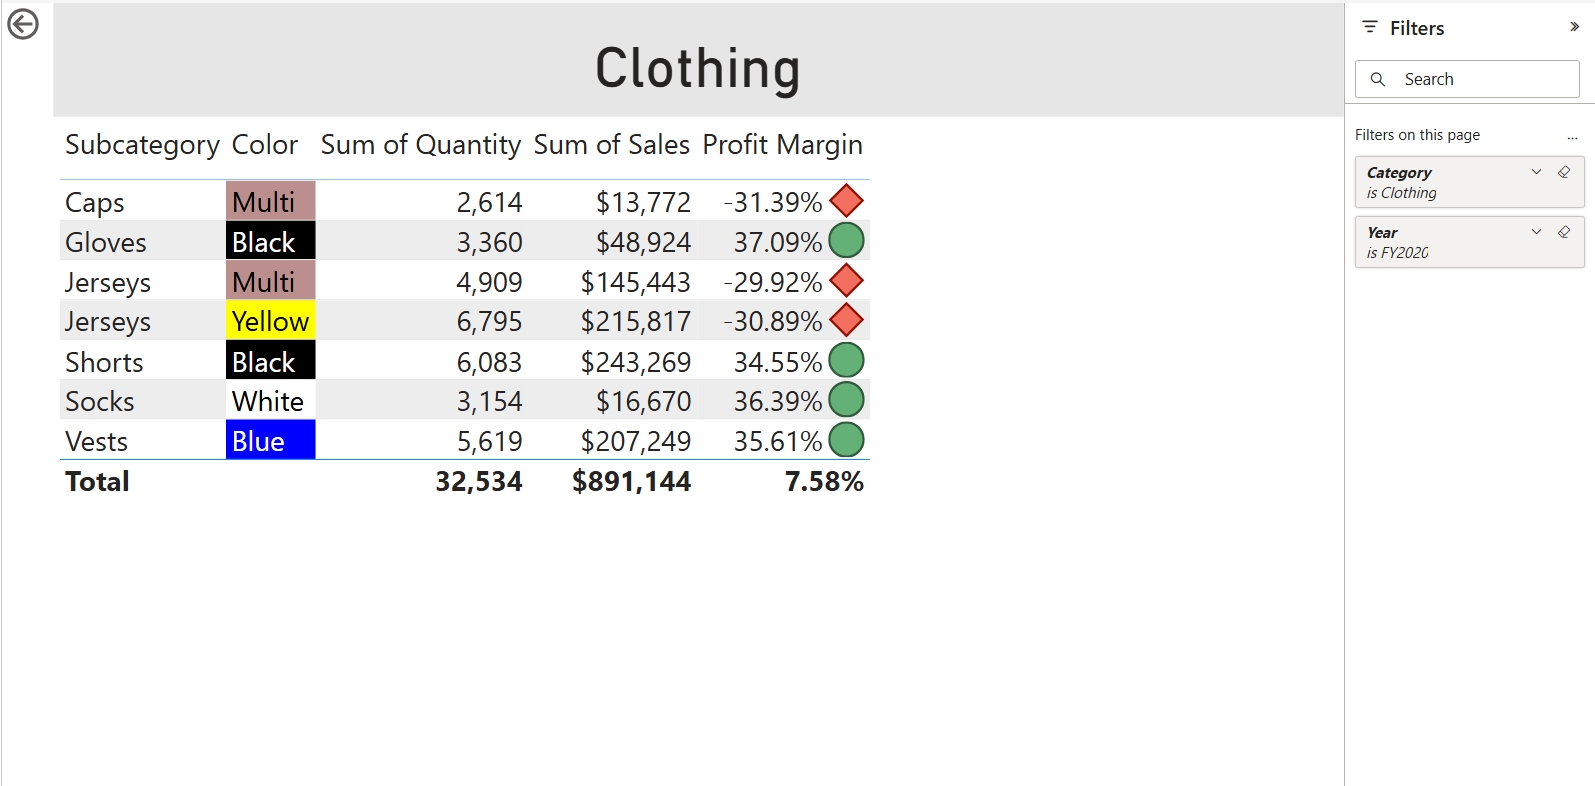
This drill-through page displays a table of subcategory, color, total quantity, total sales, and profit margin, which appears when clicking on any part of the “Total Sales by Country and Category” or “Total Quantity by Category” visuals on the overview page.
This report page showcases a table displaying year, orders, total sales, profit, and profit margin, with a filter slicer for region. Filters on this page include data fields for category, subcategory, product, and color.
This report page features a filter slicer for the year, a KPI visual card displaying total sales, target amount, variance, and variance margin, and a toggle chart for total sales and targets by month. Two yellow buttons allow switching between a bar chart or a column chart of the same data.
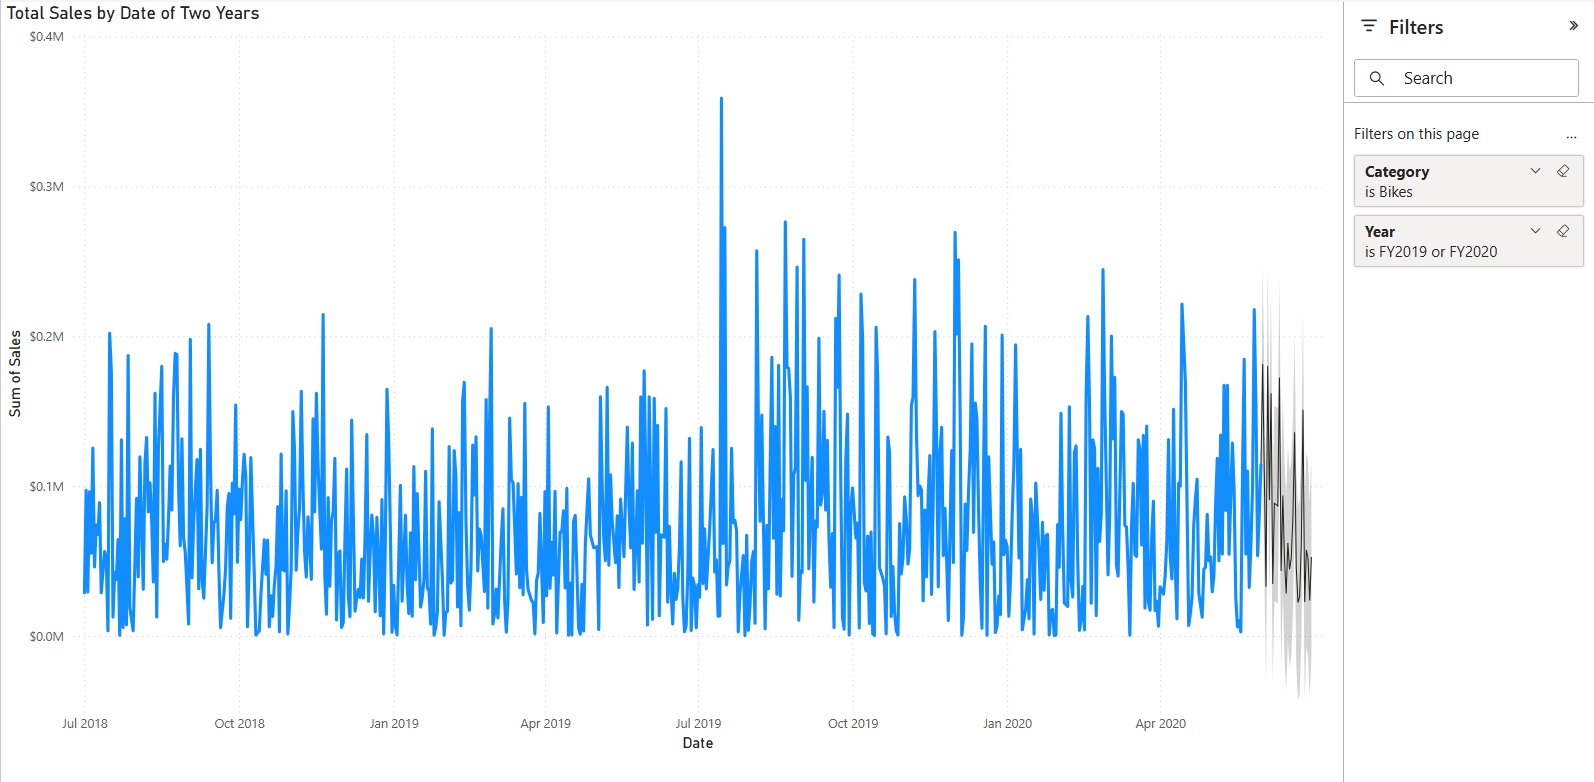
This report displays a line chart of historical total sales by date over the past two years, used to forecast future sales for the next month.
Use the interactive charts and filters below to explore trends and patterns.


